Preview · this article is in the editorial review queue and is not yet approved for publish.
Review & approve →
Learn how to visualize and analyze GPU memory in PyTorch using the Memory Snapshot tool, aiding in identifying patterns of memory usage and optimizing code. Essential for deep learning development.
Visualizing and Understanding GPU Memory in PyTorch
PyTorch developers may be familiar with the common error message: CUDA out of memory. However, understanding why and how to fix it can be more challenging. In a recent series of articles on the PyTorch blog, the company provides tools for debugging out-of-memory errors and improving memory usage.
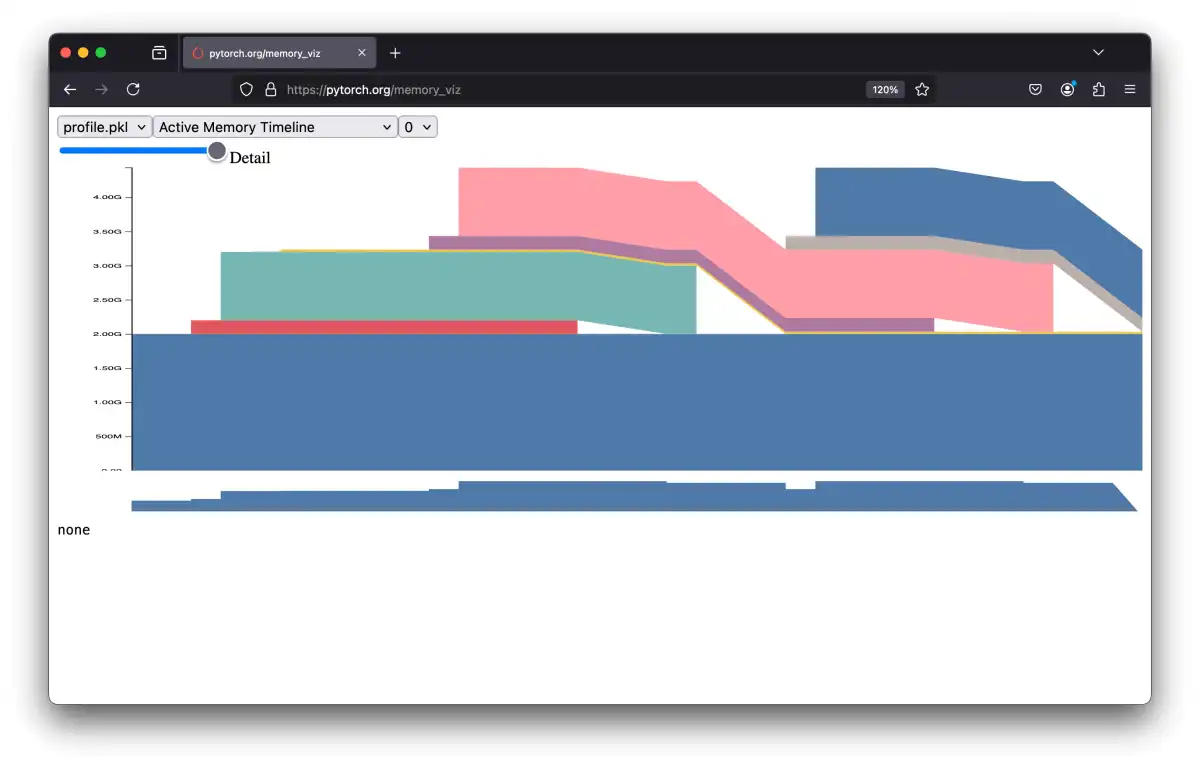
The first article in this series focuses on visualizing GPU memory using the Memory Snapshot tool. This interactive visualization allows developers to observe stack traces for any allocation by mousing over the graph. The snapshot shows memory events, including allocations, frees, and OOMs, along with their stack traces. By analyzing these snapshots, developers can identify patterns in memory usage and optimize their code accordingly.
The API to capture memory snapshots is straightforward and available in torch.cuda.memory. Developers can start recording memory history using `torch.cuda.memory._record_memory_history(max_entries=100000)`, save a snapshot to file with `_dump_snapshot(file_name)`, and stop recording history with `_record_memory_history(enabled=None)`.
In addition to the Memory Snapshot tool, PyTorch provides other tools for debugging out-of-memory errors. The Memory Profiler allows developers to visualize memory usage over time, while the Reference Cycle Detector helps identify memory leaks caused by reference cycles.
Background and Context
GPU memory management is a critical aspect of deep learning development. As models become increasingly complex, they require more memory to train and run efficiently. However, GPU memory is limited, and running out of memory can cause training to fail or slow down significantly.
PyTorch developers use various tools to manage GPU memory, including the Memory Snapshot tool, Memory Profiler, and Reference Cycle Detector. These tools help identify memory leaks, optimize memory usage, and improve overall performance.
Why it Matters to the Industry
The adult industry relies heavily on deep learning models for tasks such as content moderation, recommendation systems, and video processing. As these models become more complex, they require more memory to train and run efficiently. Understanding GPU memory management is crucial for developers working in this industry.
By visualizing and understanding GPU memory usage, developers can optimize their code to reduce memory consumption and improve performance. This is particularly important for large-scale applications that require significant computational resources.
What Comes Next
The PyTorch blog series on GPU memory management provides a comprehensive guide for developers looking to improve their skills in this area. By following the tutorials and using the provided tools, developers can optimize their code and improve overall performance.
In addition to the Memory Snapshot tool, PyTorch offers other resources for debugging out-of-memory errors. The company's documentation includes detailed guides on memory management, optimization techniques, and troubleshooting common issues.
Key Facts
- The Memory Snapshot tool provides an interactive visualization of GPU memory usage.
- The API to capture memory snapshots is available in torch.cuda.memory.
- PyTorch developers use various tools to manage GPU memory, including the Memory Profiler and Reference Cycle Detector.
- Understanding GPU memory management is crucial for deep learning development in the adult industry.
- The PyTorch blog series on GPU memory management provides a comprehensive guide for developers looking to improve their skills in this area.
Conclusion
Visualizing and understanding GPU memory usage is essential for deep learning development. By using tools like the Memory Snapshot tool, developers can optimize their code and improve overall performance. The PyTorch blog series on GPU memory management provides a comprehensive guide for developers looking to improve their skills in this area.
As the adult industry continues to rely heavily on deep learning models, understanding GPU memory management becomes increasingly important. By following the tutorials and using the provided tools, developers can optimize their code and improve overall performance.